eneve - wordmark - white 1

find the gap between what you bill and what you procure

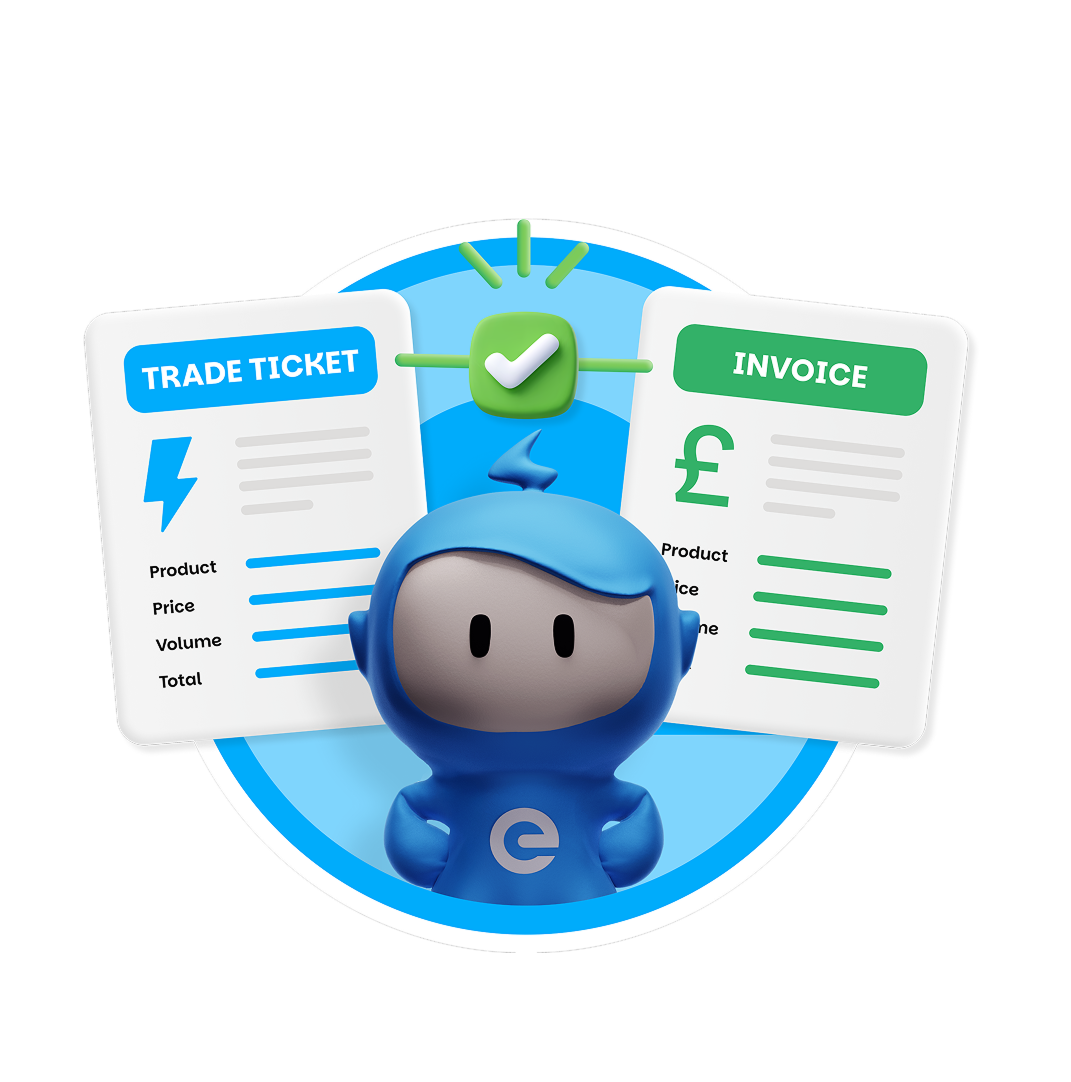
As you scale, the energy you bill customers stops reliably matching the energy you procured and allocated, and the gap compounds quietly across Finance, Portfolio, Trading, and Sales.


This six-week diagnostic quantifies every billing-versus-allocation discrepancy and gives you a monitoring framework that scales with your portfolio, so you manage the exposure instead of explaining it after the fact.

Ennie trading
Logo Eneco
Essent RGB
TotalEnergies-Logo-500x281
mega
Scholtenergie
Engie
Logo Eneco
Essent RGB
TotalEnergies-Logo-500x281
mega
Scholtenergie
Engie
Logo Eneco
Essent RGB
TotalEnergies-Logo-500x281
mega
Scholtenergie
Engie
Logo Eneco
Essent RGB
TotalEnergies-Logo-500x281
mega
Scholtenergie
Engie

As you scale, the gap widens quietly

The mismatch rarely becomes urgent because of a single event. It becomes urgent when Finance can't explain a cost variance, when the imbalance settlement statement lands bigger than expected, or when the reconciliation cycle runs longer than the reporting close.

Untitled design (8)-2
Unreliable P&L reporting

Margin calculations sit on unvalidated data. Numbers reach the board, someone notices they don't tie back to procurement, and trust in the whole reporting chain takes a hit.

Imbalance costs discovered too late

By the time the settlement statement lands, the cost has already happened. You're explaining a number rather than managing the exposure that produced it.

Manual reconciliation that doesn't scale

Spreadsheets work at 10,000 customers and break at 50,000. By the time volume has tripled, the reconciliation team is overstretched and errors leak through.

WHO THIS IS FOR

Integrated retail energy suppliers in the scale stage

...with growing volume in the Netherlands or Spain. 

2-Jul-20-2026-03-14-38-4270-PM

CFOs and finance directors accountable for imbalance costs and P&L accuracy

...as well as commercial directors whose revenue numbers depend on reliable volume and contract reporting. 

AdobeStock_1983048924 1

Heads of portfolio management, trading or sourcing

...responsible for procurement alignment and balance responsibility, and exposed to settlement discrepancies. 
AdobeStock_777686025 1

WHAT THE MARKET ENTRY SCAN DELIVERS

22
Quantified insight into the size and origin of every billing-versus-allocation gap, and margin reporting that holds up because the numbers tie back to a reconciled source.
Early identification of imbalance cost exposure before it lands as a P&L surprise. You see what's coming and can decide what to do before it becomes urgent.
A cross-departmental process design that closes the gap between Finance, Portfolio, and Trading. The same view of the truth across functions ends most of the friction by itself.
Not a one-time fix, but a practical framework of data flows, KPIs, and escalation triggers, designed to keep working as your portfolio doubles.
Our structured methodology and cross-market view cut analysis time significantly versus an internal effort. We've seen this problem at multiple suppliers, and the patterns are recognisable from the data.
Concrete recommendations with tooling guidance and a prioritised implementation plan with owners assigned.

How it works

01
Week 1: Intake and scoping

Align stakeholders on scope, data access, and timelines, map the departments involved, and confirm data availability. Closes with a signed-off project brief and a confirmed data-access plan.

02
Weeks 2 to 3: Data matching and gap analysis

We match billing data against allocation and reconciliation datasets across volume, timing, and segment. Discrepancies are logged, quantified, and categorised by source and magnitude, with a root-cause hypothesis for each material gap.

03
Week 4: Root-cause validation

Findings reviewed with Finance, Portfolio, and Trading to validate root causes and contextualise anomalies. This cross-departmental session surfaces process gaps and accountability breakdowns that data alone cannot explain.

04
Week 5: Monitoring framework and recommendations

We design a practical monitoring framework of data flows, KPIs, and escalation triggers, with tooling recommendations where relevant and a prioritised action roadmap with owners.

05
Week 6: Final presentation and handover

The full analysis, root-cause findings, monitoring framework, and roadmap presented to your team, with a clear handover protocol and the path to follow-on support where applicable.

Windmill v2 1

What you will get out of it

01

A quantified, validated view

  • ...of every material billing-versus-allocation gap in your portfolio
  • Root-caused to a specific process
  • A reporting baseline that holds up to board and investor scrutiny

02

A monitoring framework that scales

  • KPIs and escalation triggers your team runs from week one
  • Tooling recommendations sized to your portfolio
  • Designed to keep working as your portfolio doubles

03

A prioritised roadmap

  • Clear owners across Finance, Portfolio, and Trading
  • Sequenced by impact, not by vendor
  • The next steps ready to activate

What this scan changes

Patterns from nearly three decades of supporting European energy companies

FREQUENTLY ASKED QUESTIONS

Untitled design (26)
Less than you think. We start with whatever structured exports your systems can produce in week one, and any data quality issues become findings within the scan rather than blockers. The intake call walks through exactly what we need and what's optional.
Yes, by default. We separate the analysis per energy carrier where the mismatches show up differently, most often in dual-fuel suppliers serving residential and SME segments.
The scan is the diagnostic, not the rebuild. If the analysis reveals structural issues needing a deeper intervention, we name them clearly in the readout and propose the right next steps. The scan never escalates into a hidden project; you decide what comes next.
No. We'll recommend tooling where it fits, especially for ongoing reconciliation at scale, but the monitoring framework is tooling-agnostic. We design it to work with the systems you already have or plan to adopt.
Light touch. Most of the analysis is desk work done by our analysts on the data you provide. Your team is involved at three points: the intake call, the root-cause validation session in week four, and the final presentation. Roughly one day of stakeholder time across six weeks.

50+

Energy Suppliers Served

Supporting leaders of European energy to accelerate the shift to a smarter, more open and reliable energy future.

20M

Connections

Providing more than 20 million energy connections daily. From households to large-scale users.

28

Years of Experience

The trusted backbone of software and domain expertise.

Ready to find the gap before it finds you?

Start with a 30-minute call. We'll walk through your current reconciliation pain, what the scan would look like for your portfolio, and the indicative timeline. No obligation either way.


Book a free scoping call
29
Eneve wordmark
Eneve Ennie